


Custom Reports allow you to build your own reporting dashboards using Groundhogg’s reporting framework. Instead of being limited to the built-in reports, developers can create reports that visualize exactly the data they need.
Custom Reports can be used to display marketing performance, sales metrics, CRM activity, ecommerce data, plugin-specific analytics, and more!
How It Works
Custom reports can be created on the Custom tab of the Groundhogg » Reporting screen.
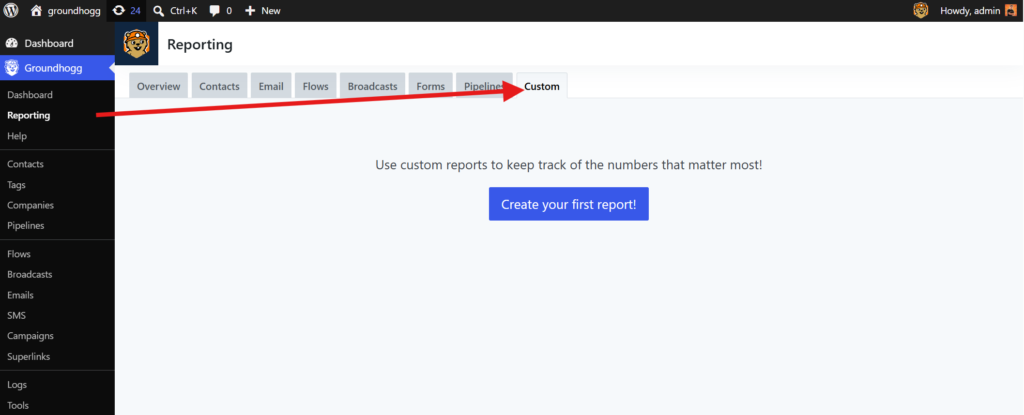
From here you can create reports and headers and drag and drop them to organize.
Reports can be grouped together into this dedicated dashboard page, making it easy to create a complete reporting experience tailored to your business.
Creating Reports
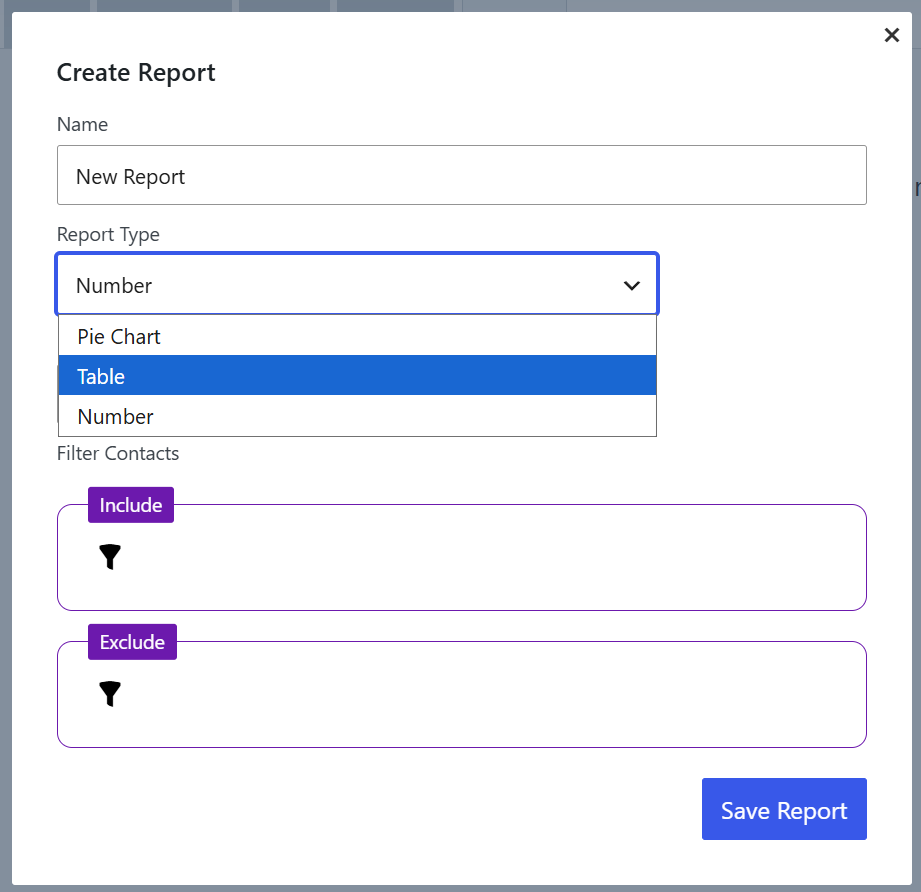
To create a report click on the [+] icon to bring up the Create Report dialog. From here you can name the report, and select the type of data visualization you want to see.
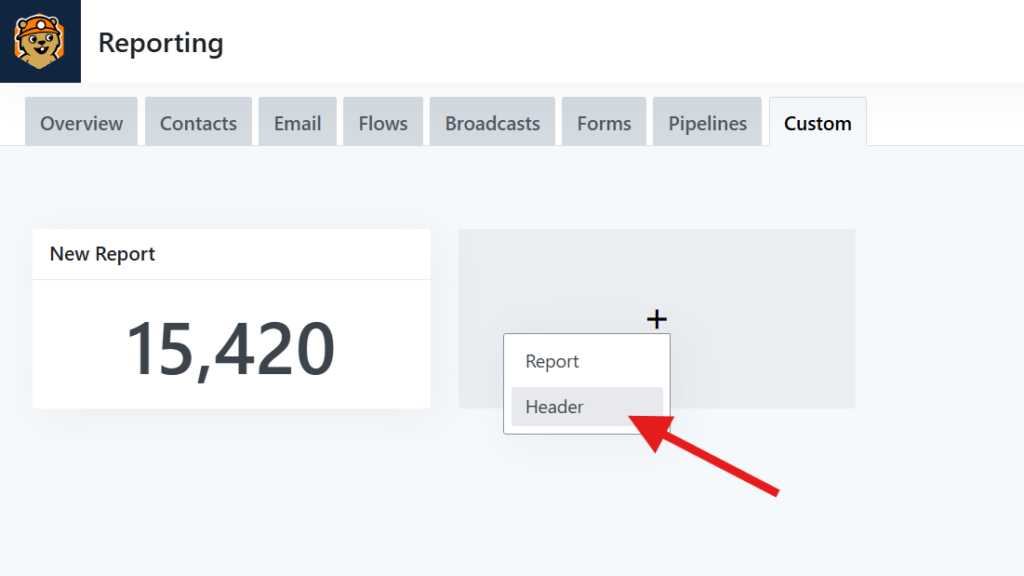
You can also create Headers to organize your reports into sections.
Report Types
Groundhogg currently provides the following formats for data visualization.
Number reports
Useful for seeing totals, sums, and averages. This report gives you a big number that can tell you want you want to know at a glance. The number can also be clicked to see the matching contact segment.
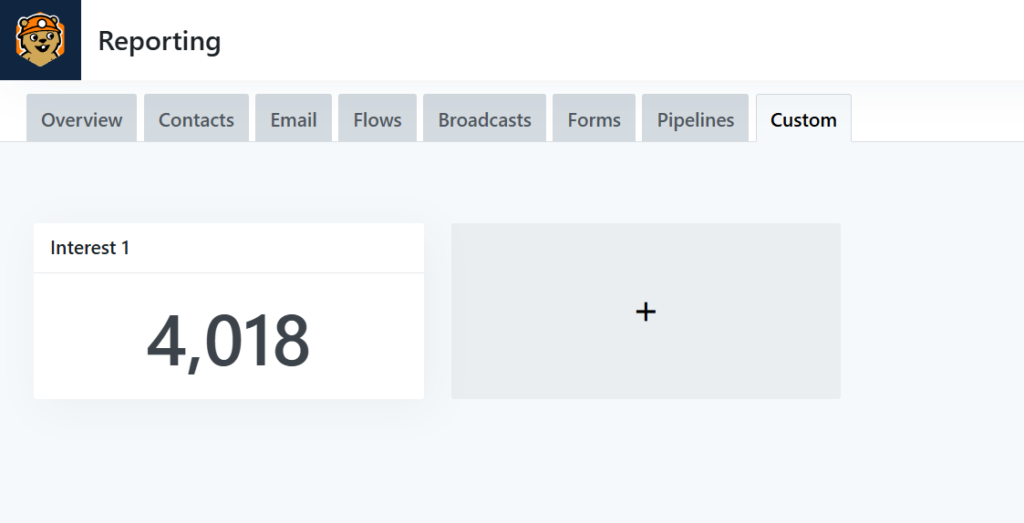
When creating a number report you must select the report value (the number that will be shown) of which you have many options.
- Total number of contacts
How many contacts match the given filters - Sum of a custom field
Adds up all the custom field values for contacts that match the filters. You must specify a custom field and the field type must be a number. - Average of a custom field
Averages all the custom field values for contacts that match the filters. You must specify a custom field and the field type must be a number. - Count of distinct custom field values
The number of distinct values in any type of custom field. You must specify a custom field. - Count of activities
The total number of activities among contacts that match the filters. You must specify an activity type. - Sum value of activities
The sum of the activity values for all specified activities among contacts that match the filters. You must specify an activity type. - Average value of activities
The average among the activity values for all specified activities among contacts that match the filters. You must specify an activity type.
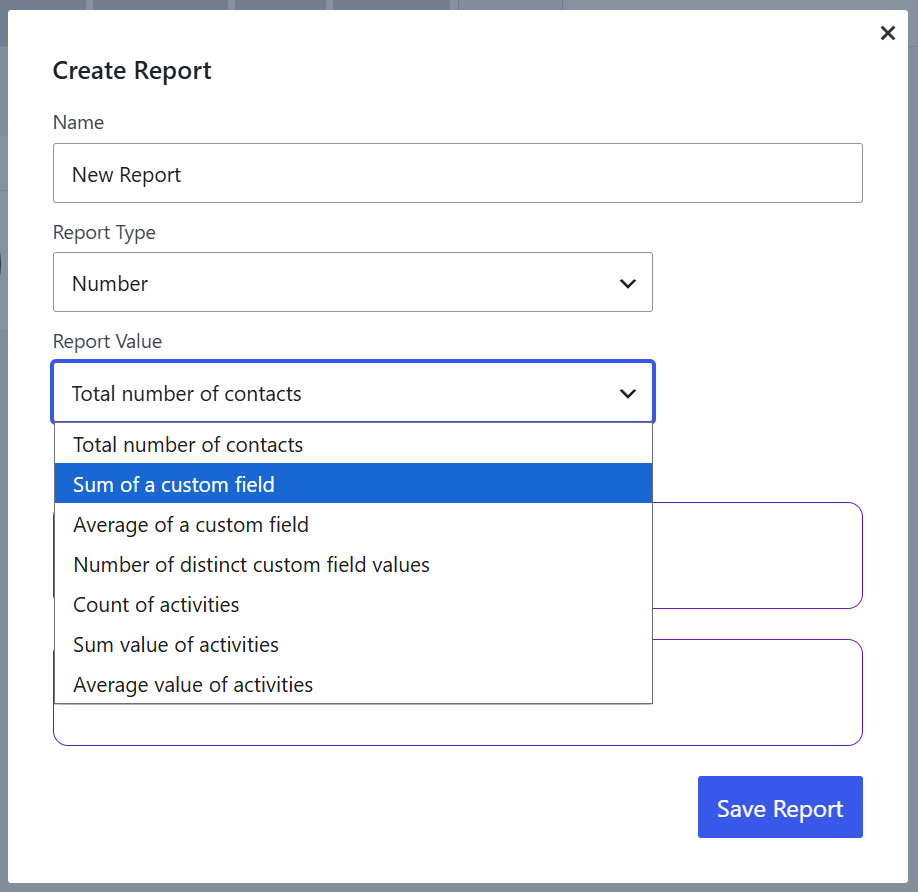
Table Report
Table reports allow you to show a pivot table based on the values of a custom field for a segment of contacts.
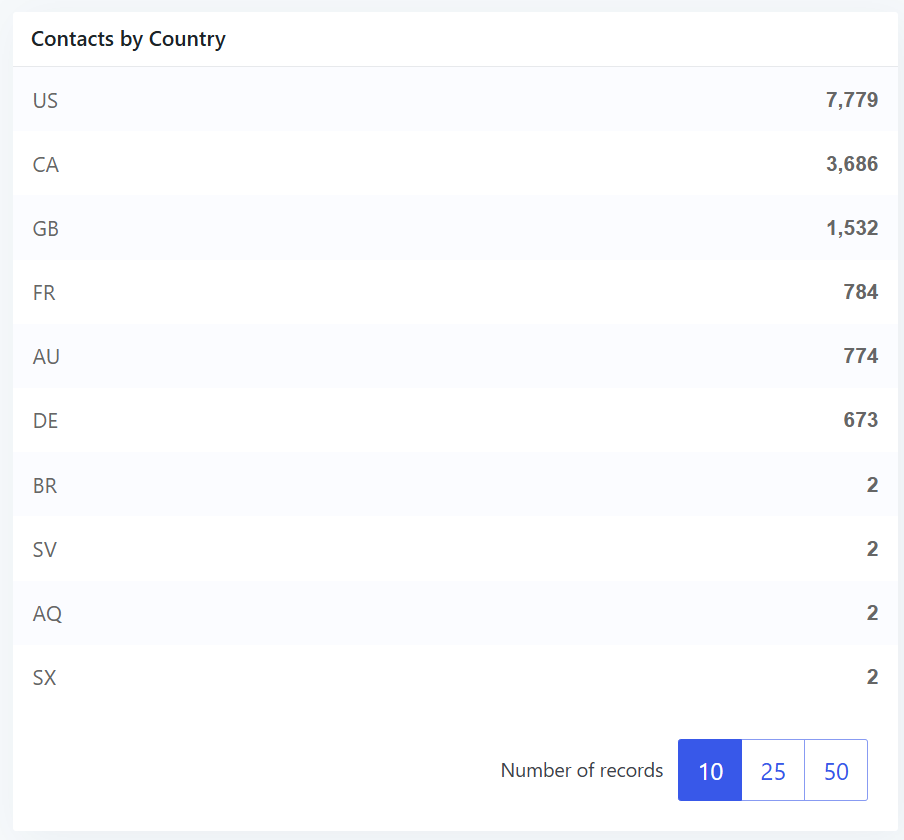
If there are more than 10 results, you’ll see pagination to view more.
All of the numbers can be clicked to bring up the segment in the contacts list.
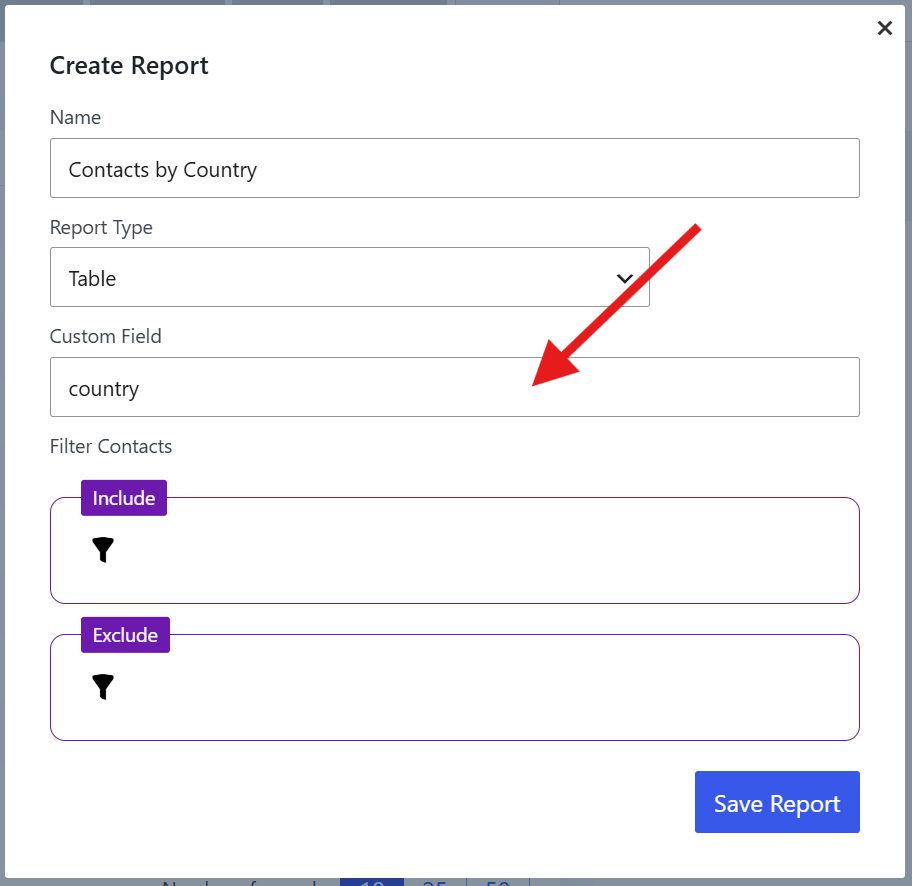
To create a table report, simply select the custom field you wish to report on.
Pie Chart Report
Similar to the table report, it shows the total number of contacts grouped by custom field values.
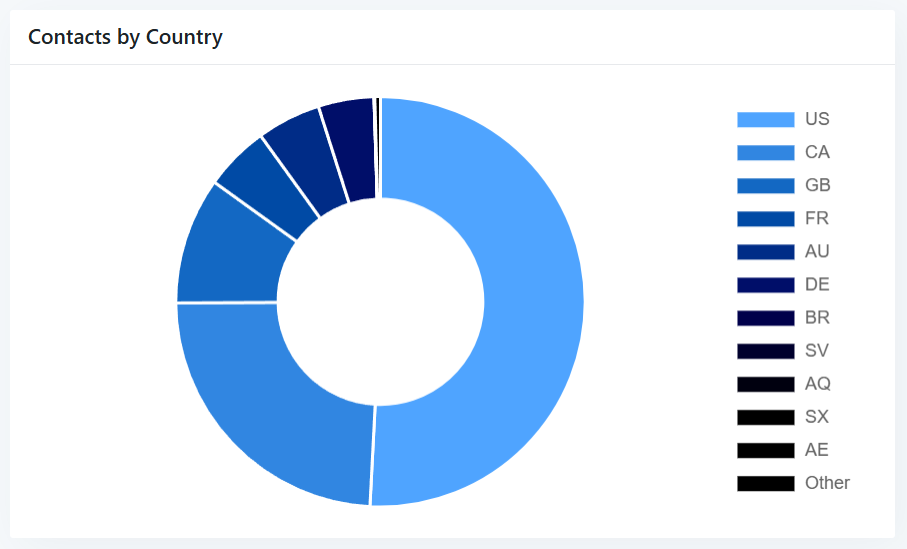
It’s settings are identical to the table report type. If there are more than 10 results any additional results will appear under other.
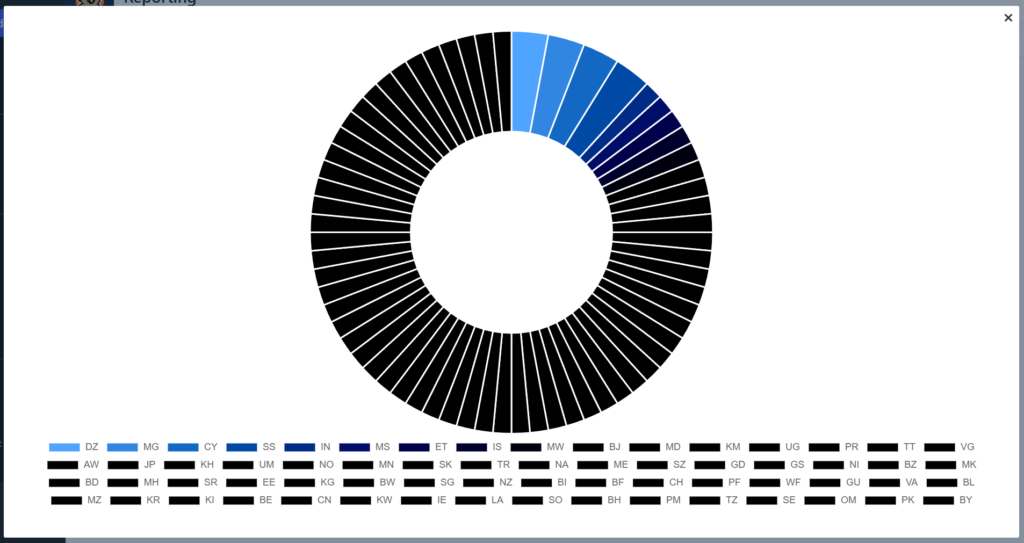
The pie segments can be clicked to bring up the contact list.
Segmenting with filters
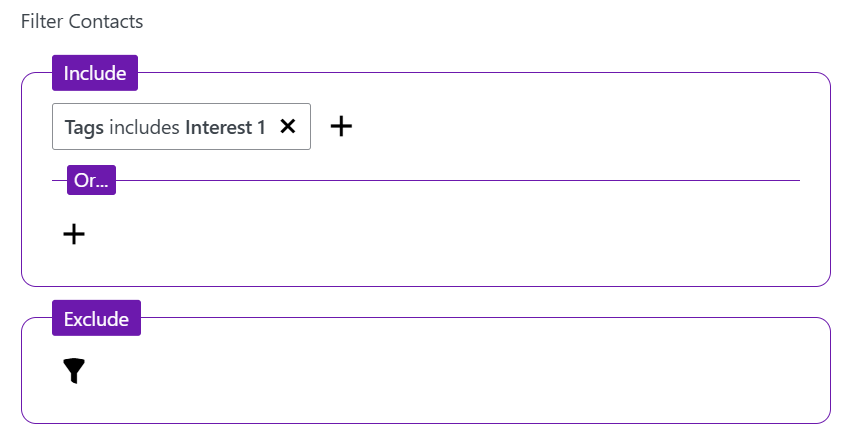
All report types provide the option to segment the report data with contact filters. For example, if you only want to see the sum of a custom field for a group of contacts that have a specific tag. You can leave the filters blank to report on your entire contact list.
Applying a date range
Unlike the other built-in reports, there is no date range selector for custom reports because the type of reported data is not conducive to date ranges by default.
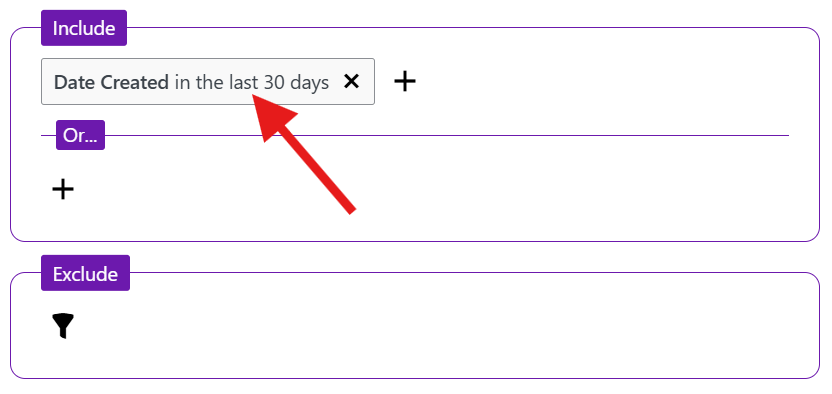
You can however, apply a date range to a specific report by using a filter that has a date range setting. For example, if you want to run a report but only on contacts created in the last 30 days, you can do so using the Date Created filter.
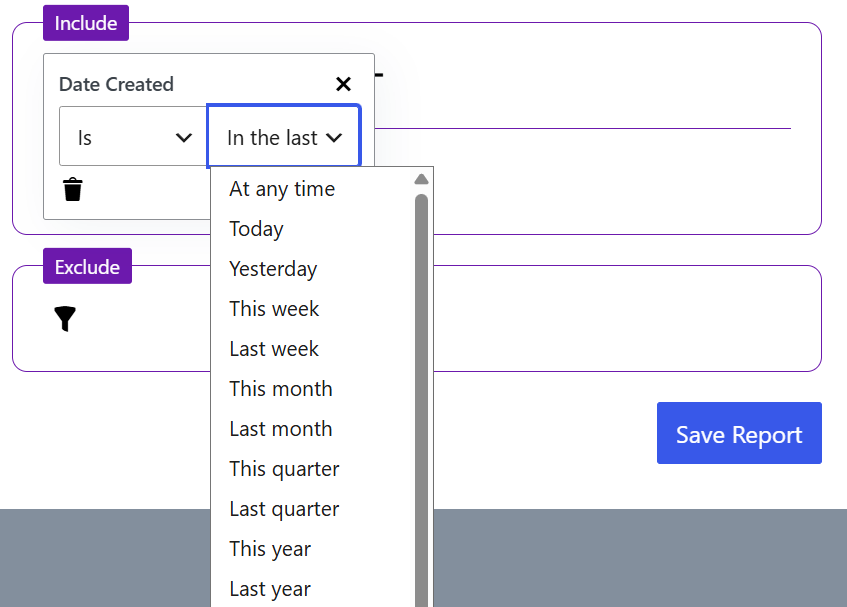
To change the date range for a report to compare data, you can edit the report and change the date range in the filter settings.
Was this helpful?
Let us know if this document answered your question. That’s the only way we can improve.